Core workflow
- 01
Set a BASIC line, assembly-source or manual machine breakpoint.
- 02
Start Debug from a build whose provenance matches the current source.
- 03
Use language-level or instruction-level stepping according to the question you are answering.
- 04
Inspect variables, registers, stack, disassembly, memory and captured screen evidence before editing.
OPERATIONS & REFERENCE
BASIC breakpoints
Place a breakpoint on the intended source line and start Debug from a current build. For linked music BASIC, preserve the linked source identity: a line number can also occur in another file. Check that the stopped line and visible source match before stepping.
Z80 source breakpoints
Set the breakpoint on an assembly source instruction after assembling the current module. The source map and accepted/running bytes must agree. If the module changed, refresh those artifacts before trusting a stop at an old address.
Logical and banked addresses
Use logical addresses for the visible CPU map, and physical-bank identity when inspecting banked RAM. On 128K, two resources can occupy the same logical window in different banks. Qualify breakpoints and assertions accordingly.
Stepping commands
Use Step BASIC Line for language-level behavior, Step Instruction for one opcode, Step Over for calls and Run to Return for a bounded return question. If execution stops somewhere unexpected, inspect the stack and disassembly before asking AI to rewrite the routine.
Registers and disassembly
Pause and compare PC, registers, instruction bytes, symbols and the highlighted source. Read the stack when diagnosing a bad RET or CALL. Record only values from the current stopped session; stale displays and a different build can give contradictory clues.
BASIC variables and watchpoints
Inspect variables near the branch being diagnosed and compare values before and after a step. Use watchpoints where a memory change is the question. Choose a small set of relevant values rather than treating a complete memory dump as an explanation.
48K timing telemetry
In the Timing inspector, examine frame, scanline, CPU clocks and contention counters for the loaded 48K target. Use changes between observations to investigate timing. These counters are measurements of the integrated model, not a blanket hardware certification.
128K timing inspector
The inspector identifies the loaded target and exposes its corresponding timing counters. Scroll the compact panel to see all rows. Keep 48K and 128K measurements labeled separately; do not interpret a target switch as merely a cosmetic change to the same timing model.
Deterministic project tests
Define reproducible key input and explicit runtime expectations, then run the test against a fresh project build. Check recorded failures and screen evidence. An assertion is useful when it distinguishes success from a plausible but wrong result; avoid tests that pass simply because a timeout occurred.
Bank-aware assertions
For 128K memory checks, specify the intended physical bank as well as the address. Run the project test and inspect its saved evidence on failure. A check of the current logical window may otherwise inspect a different bank from the resource you meant to test.
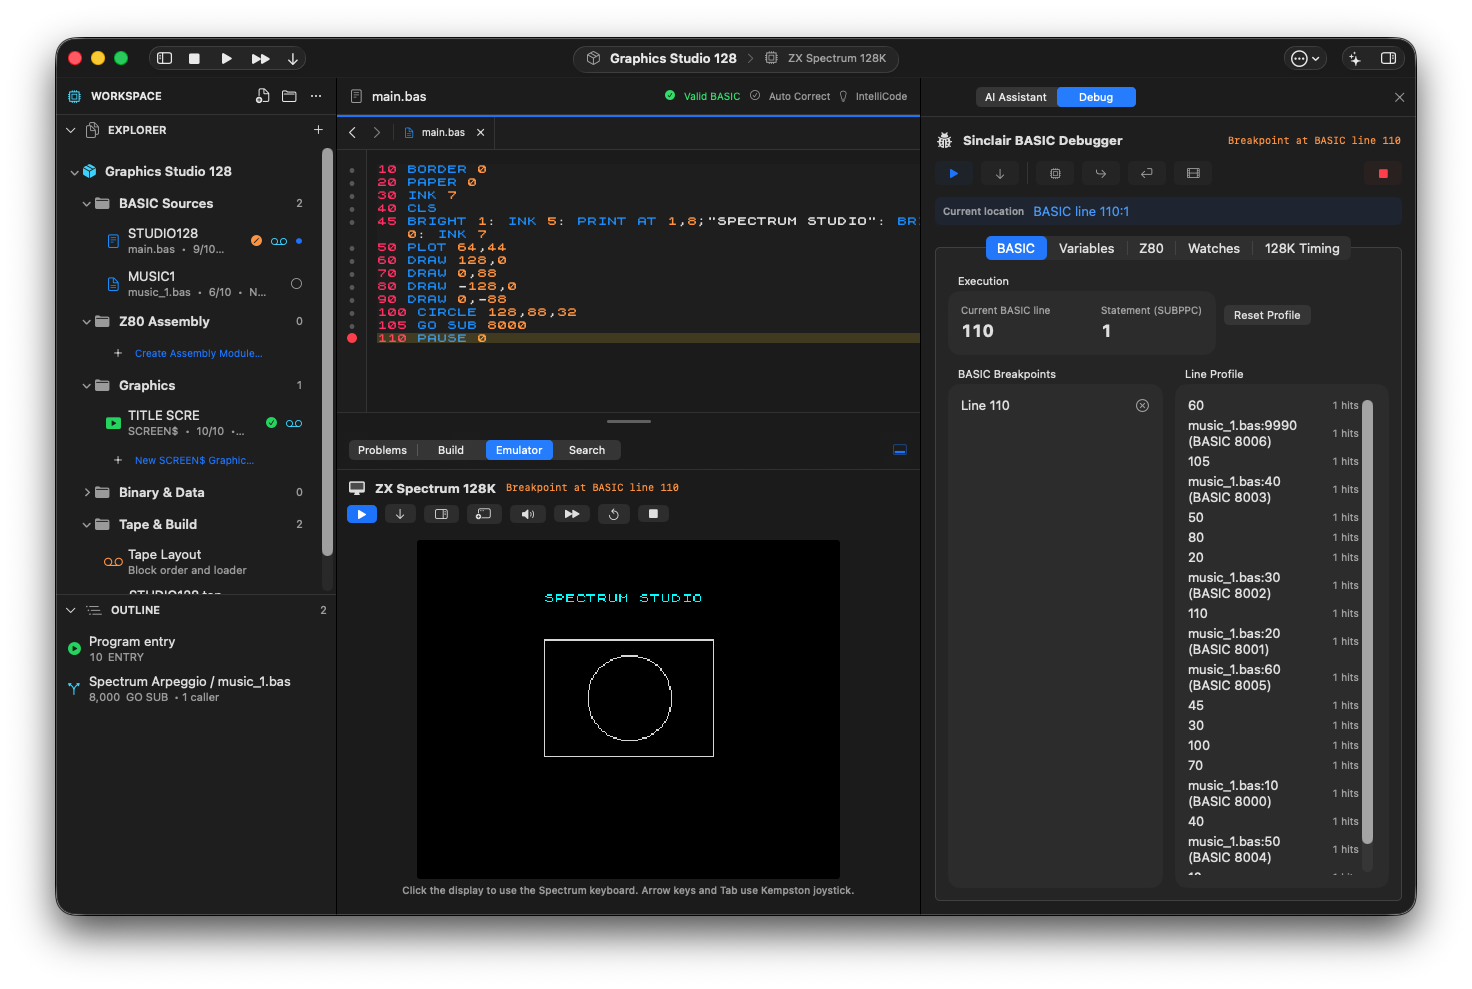
The 128K project stopped at BASIC line 110, after GO SUB 8000 returned. The line profile maps the linked music routine back to music_1.bas.
Review checks
PC, disassembly, symbol and highlighted source refer to the same instruction.
Watchpoints and variable annotations belong to the current project.
Deterministic tests use exact frame timing and isolated machine state.
Boundaries
Target-aware timing counters describe the integrated runtime, not blanket physical-hardware certification.
Visible UI evidence and automated runtime evidence are separate proof layers.